By Ted McEnroe, The Community Roundtable
Having just enjoyed (survived?) my first season writing and editing for the State of Community Management 2015, one of the most interesting parts of the post-release followup is actually seeing what pieces resonate with people. They seem to fall into three categories.
The Key Indicators Data
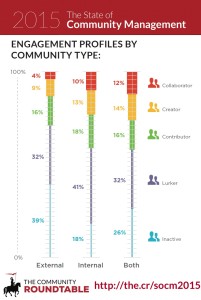
 No shockers here. It’s my first time at this rodeo, but there were data that I knew would generate interest in the research – and did, including our look at community engagement profiles. The engagement profile data is like the SAT for community managers. It’s an easy way to compare your community performance with others near and far – even though it’s a stat that can be prone to misinterpretation depending on how you use it.
One thing we worked on for this report was comparisons of how the data changed with different use cases. One piece of the SOCM I enjoyed writing was the discussion of what including inactive users does to the engagement profiles of internal and external communities. The shift in the numbers depending on whether you count inactives (those who don’t even log in) or not shifts numbers markedly, and depending on your community use case it can clarify or obfuscate your “real” engagement. Interestingly, with inactives excluded, the engagement profiles of internal and external communities differed less than you might think.
The Journey Data
The old saw “Where you stand depends on where you sit” might need an addendum – “…and how long you have been there!” There is a series of data in the SOCM that younger community managers may not fully appreciate, but those who have been working in the space for a long time love – data I think of as “journey data.” They’re things like the percentage of communities that have budgets approved by or report to the C-suite.
It’s data that newer community professionals can easily dismiss, but for some of our more seasoned colleagues, it’s a reminder of how far we have come in connecting communities to business objectives. Executives may not understand community in many cases, but awareness, responsibility and engagement are improving.
The Now Data
These are the correlations that can drive actionable ideas, and I don’t have a favorite in this group, because they vary for any community. Looking for things to get new members engaged? There are a lot of things you can do – and there is data to back up the ideas. Feel like you need to get a handle on your strategy, create a roadmap, build that crisis plan to get your community to the next level? There’s data there to back up that assertion.
There’s also data that demonstrate the work we need to do in the community space. Too many communities have a strategy, but no resourced roadmap to get there. That’s like saying you want to move to Mars, but have no idea where it is in the sky and/or no rocket to get there. We obsess about ROI but at the end of the day most of us haven’t figured out how to measure it for our communities. These aren’t easy problems to solve, but each year, we get more data with stories behind them that make us all a bit smarter about solutions. I love hearing people say we’ve given them data that helps them move forward. Research is at the core of what we do – it transforms good ideas into sensible strategies.
Every year, we are honored to have so many people say that SOCM release day is one of their favorite days of the year. We hope you’ll share the stories of the value it provides for your work, and take part in our research to help inform community programs, their members, their professionals and their stakeholders.
The State of Community Management 2015 is an indispensable resource for community professionals seeking to understand their communities, and the State of Community Management survey can provide you insights and scoring of your community maturity. Download the report and take the survey!
