By Ted McEnroe, Director of Research and Training, The Community Roundtable
 The value of The State of Community Management in 2011 and 2012 was to give definition to the competencies and qualities of communities. By 2013, we were ready to shift the focus of the research to something different but equally game changing – quantifying what community management looks like.
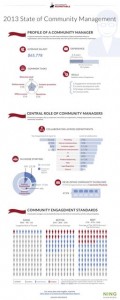
The State of Community Management 2013 report was our landmark first effort to apply a quantitative lens to what had been considered the “art” of community. Our first survey and subsequent report explored community data in four general areas: community management, community program, community demographics and community profiles (use case, budge, management resources, etc.).
Community leaders in 2013 saw themselves at the vanguard of organizational change – 55% described their organizations as “innovators” and 43% said their organization was “fully networked.” But even taking into account the relatively advanced maturity of this group, the findings broke down some long-held myths about community.
Respondents outlined a community management role that was more complex, and required more experience in organizational communication and less technical acumen than traditionally assumed.
 Respondents highlighted the inherent tension in a role that bridged internal and external audiences, and the stresses that created, especially in large communities with few resources.
Respondents began to define the standard elements of community and those more common in communities that could measure their value – highlighting for the first time the power of new member programs, advocate recognition programs and regular community member input in decisions affecting the community.
The responses also highlighted the key metrics of community – and the recognition that traditional social media metrics didn’t apply well to measuring community programs’ success.
And perhaps most notably – the report provided critical quantitative evidence that the “90-9-1” rule was a flawed model. Rather than 90% lurkers, 9% contributors and 1% content creators, the report found even average communities averaged 55% lurkers, 30% contributors and 15% creators.
 The 2013 report set the standard for our ensuing research, which has continued to get beneath the surface of what community management looks like and the power of communities to drive behavior change.
This post is part of a series on the history and findings of the State of Community Management reports. The survey period for the State of Community Management 2016 is open now, at https://the.cr/socm2016survey. Participants receive their own community maturity report for their time – and your next coffee is on us!
